Growave Analytics
On the home page of the admin panel, there is a Performance summary with analytics of all our apps (excluding the Instagram app) for the last 30 days. If the app is turned off, it's easy to enable it by clicking the ‘Learn more’ button.

Moreover, you can find the Analytics section in the sidebar menu of the Admin Panel:

Rewards
Let's begin with the Rewards which contain 3 sections (Points, VIP Tiers, and Referral Program):
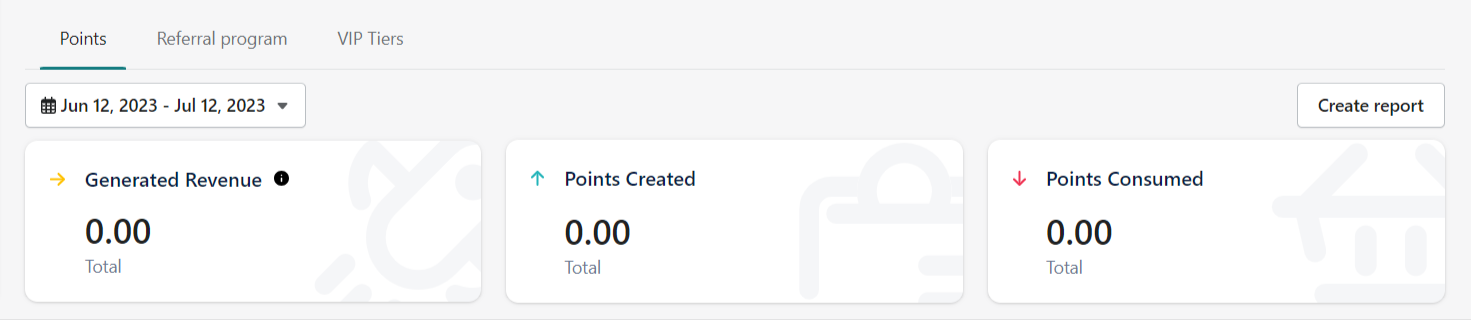
Generated Revenue (Points) - shows the total amount of money that customers spend when placing orders using the discounts generated by the entire Loyalty & Rewards program. Also, you can see the number of created and consumed points.
Generated Revenue (Referral) - shows the revenue from the orders placed using the discounts generated by the Referral program. It also counts all subsequent orders placed by referrals who made their first purchase using the promo code. You can also track the generated traffic.
Reviews

Review requests sent - The number of review requests sent according to the orders.
Reviews collected - The number of reviews collected in response to the review request sent.
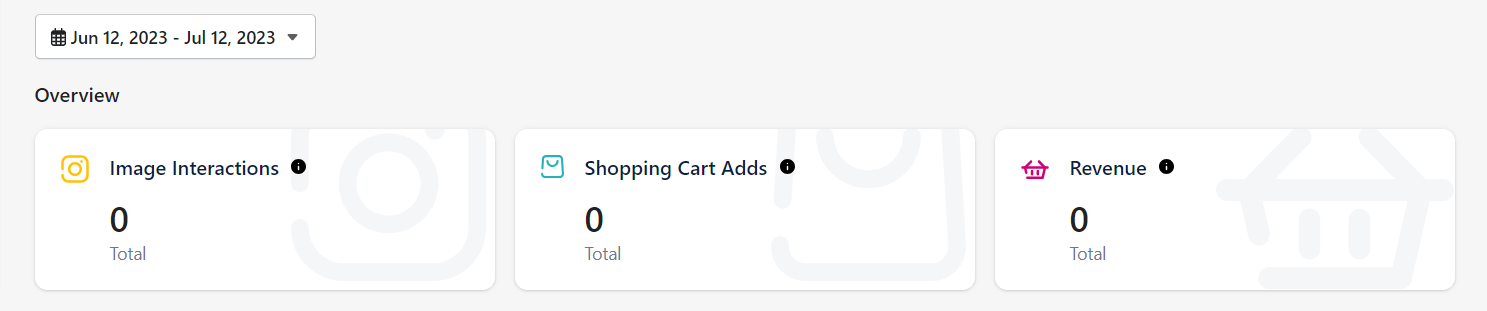
Image Interactions - shows the number of times the posts from the Instagram gallery were opened on the storefront.
Shopping Cart Adds - the number of products that were added to the shopping cart from the Instagram gallery post.
Revenue - shows the number of products that were bought after adding them to the cart.
Wishlist
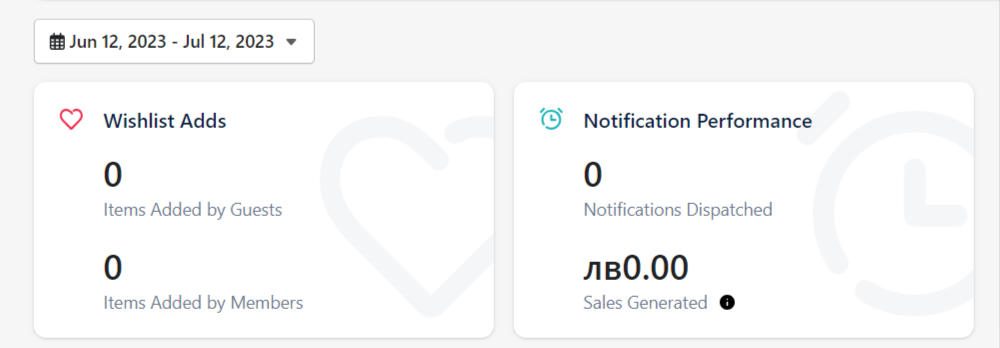
Wishlist Adds - shows how many products were added to the Wishlist by guests/members.
Notification Performance - shows how much money was generated through wishlist reminders.
That's it! If you have any questions or need help, feel free to contact us at support@growave.io or by chat icon in the bottom-right corner.